Our commitment goes beyond delivering the highest quality products.

Precision Technology for a Smarter Future
Focusing on environmental sustainability, we help our clients make informed decisions through reliable data, empowering them to address challenges related to water flow, quality, and ecosystem health.
Precision Technology for a Smarter Future
Focusing on environmental sustainability, we help our clients make informed decisions through reliable data, empowering them to address challenges related to water flow, quality, and ecosystem health.
about

Your Trusted Partner in Precision Technology

AKP Instruments and Consultants is a leading provider of hydrological services and environmental monitoring solutions, specializing in flood forecasting, river management, and sustainable water resource management. We leverage cutting-edge technology and a team of experts to provide precise data and actionable insights for clients across various industries.

New Arrivals

Structural Analysis Data Processing and Simulation Tool

Description:

This online platform is designed for civil engineers, architects, and structural analysts to perform detailed structural analysis based on field data. The website allows users to upload raw data collected from construction sites or structural surveys (such as load measurements, material properties, and structural geometry) and automatically generates comprehensive analysis results for evaluating the safety, stability, and performance of buildings and infrastructure.

Key Features:

  • Data Upload and Integration: Users can upload a variety of structural data formats such as CSV, Excel, and DXF files, including measurements of loads (dead, live, wind, seismic), material properties (e.g., Young’s modulus, Poisson’s ratio), and structural geometry (e.g., beams, columns, trusses). The platform supports both 2D and 3D models for more complex structures.
  • Structural Load Analysis: The website processes input data to calculate internal forces, moments, and shear stresses for various types of loads (static and dynamic). Users can specify load types, load distribution, and loading conditions (e.g., point loads, uniform loads, or varying loads) to perform detailed analysis.
  • Finite Element Analysis (FEA): For advanced analysis, the platform integrates finite element analysis (FEA) to model the structural response of materials and components under various loads. It automatically generates stress-strain distribution, deflection profiles, and other essential parameters for understanding structural behavior.
  • Stress and Strain Analysis: The website calculates the distribution of stress and strain across structural elements such as beams, columns, slabs, and foundations. It helps identify weak points and potential failure risks, ensuring that the structure meets safety standards.
  • Material Properties Analysis: Users can input material properties, including tensile strength, yield strength, and other characteristics, and the platform will analyze how the materials respond to applied loads, allowing for optimal material selection and design adjustments.
  • Deflection and Deformation: The platform automatically calculates deflections and deformations in the structure, helping to ensure that movements are within acceptable limits as per design codes. It allows users to evaluate how different load scenarios impact the shape and movement of structural elements.
  • Seismic and Wind Analysis: The website provides tools for conducting seismic and wind load analysis. Users can input seismic zone information and wind pressure data to calculate the impact of these forces on the structure, ensuring that it can withstand extreme weather or earthquake events.
  • Dynamic Analysis: For structures subjected to dynamic loads (e.g., vibrations, impacts, or machinery), the platform performs dynamic analysis, determining natural frequencies, mode shapes, and vibration responses to ensure that the structure will not resonate under operational conditions.
  • Safety Factor and Stability Check: Based on the calculated stresses and load combinations, the website provides safety factor values to assess whether the structure is safe under all load scenarios. It also evaluates structural stability, identifying potential buckling, shear failure, or collapse risks.
  • Code Compliance: The platform automatically checks the analysis results against relevant design codes and standards (e.g., AISC, Eurocode, IS codes). It provides compliance reports, highlighting whether the design meets the necessary regulations or if adjustments are needed.
  • Visualization and Reporting: After the structural analysis is complete, the platform generates easy-to-understand visualizations such as force diagrams, deflection curves, stress distribution maps, and 3D models. These visual outputs help users interpret complex analysis results. Users can also generate detailed reports with findings, recommendations, and calculations in formats like PDF, Word, or Excel.
  • Scenario Simulation: Users can simulate different scenarios by adjusting load conditions or material properties and assess the impact on the overall structural performance. This helps in making design decisions and ensuring optimal safety and cost-effectiveness.
  • Export and Collaboration: Once the analysis is complete, users can export the results, including models, reports, and data sets, in various formats for further use in design software or to share with team members, contractors, or stakeholders.

How It Works:

  1. Data Upload: Users upload their structural data, including measurements (loads, dimensions, material properties), and choose the type of analysis they want to perform (static, dynamic, seismic, etc.). The data may include field test results, survey measurements, or sensor data collected during construction.
  2. Model Creation and Analysis: The platform processes the input data, creating a digital model of the structure. The system then performs the required structural analysis, calculating key parameters such as internal forces, deflections, stresses, safety factors, and more.
  3. Results Visualization: After the analysis is complete, the platform presents the results in an interactive, graphical format. Users can view force distribution diagrams, stress contours, and deformation plots for a clear understanding of structural performance.
  4. Optimization and Adjustments: Users can adjust the input data, such as load conditions, material properties, or design parameters, to optimize the structure’s performance. The platform provides real-time feedback on how these changes affect the analysis.
  5. Reporting and Export: Finally, users can generate detailed reports that summarize the analysis process and results, including calculations, graphical outputs, and code compliance checks. These reports can be exported for use in presentations, further design work, or regulatory submissions.

Bathymetry Survey

Description

This online platform is designed for professionals working in the fields of hydrology, oceanography, and environmental science. It allows users to upload bathymetric data and generate detailed visualizations of underwater topography, such as lake or ocean floor contours, depths, and features. The website uses advanced data processing algorithms to convert raw bathymetric measurements into usable maps, 3D models, and other graphical outputs.

Key Features:

  • Data Upload and Integration: Users can upload bathymetric data collected from various sources, including sonar surveys, echo sounders, or remote sensing tools. The platform supports a range of data formats, such as CSV, XYZ, LAS, or GeoTIFF, which are commonly used for bathymetric measurements.
  • Depth Mapping: The website processes the bathymetric data to create detailed depth maps that display the underwater terrain of lakes, rivers, seas, and oceans. These maps can be generated with varying degrees of resolution depending on the data's quality and density.
  • Contour Line Generation: The platform generates contour lines based on the depth measurements, providing users with clear visual representations of underwater topography. These contour lines are essential for understanding features like underwater slopes, basins, and ridges.
  • 3D Visualization: One of the standout features of the website is its ability to create 3D models of the bathymetric data. Users can view the terrain from various angles, zoom in on specific areas, and explore the bathymetry in an interactive 3D environment. This is particularly useful for detailed analysis or presentations.
  • Seafloor/Bed Mapping: The platform can also produce seafloor bed maps showing the types of sediment, bedrock, or other features present in the water body. This feature is important for habitat mapping, sediment analysis, and environmental assessments.
  • Time-Series Analysis: If multiple bathymetric surveys are conducted over time, the platform can compare and analyze changes in underwater topography. This feature helps monitor the effects of erosion, sediment deposition, and other dynamic processes affecting the seafloor.
  • Data Quality and Validation: The platform includes tools for quality control, where users can visualize the data distribution, check for anomalies, and validate measurements. Outliers or errors in the bathymetric data can be flagged for correction before further analysis.
  • Hydrographic Modeling: The website may integrate with hydrographic or hydrodynamic models, allowing users to input bathymetric data for flood modeling, wave simulations, or current flow analysis. This integration helps assess the impact of water movements on underwater features.
  • Export and Reporting: Once the bathymetric data is processed, users can export the generated maps, 3D models, and contour lines in a variety of formats such as PDF, GeoTIFF, or Shapefile for use in reports, publications, or further geographic information system (GIS) analysis.
  • Geospatial Compatibility: The platform can integrate with GIS software, enabling users to overlay bathymetric data with other geographic data sets such as satellite imagery, land topography, or environmental data.

How It Works:

  1. Data Upload: Users upload their bathymetric data from field surveys or remote sensing instruments. The data must include precise measurements of depth and location (e.g., latitude, longitude, or XYZ coordinates).
  2. Data Processing: The platform processes the raw bathymetric data, interpolating missing values, correcting errors, and converting the data into a format suitable for visualization and analysis. It can apply various algorithms to generate depth contours, topographic features, or 3D models.
  3. Visualization and Analysis: Once the bathymetric data is processed, users can explore the results using interactive tools such as depth maps, contour plots, and 3D models. The website allows users to rotate, zoom, and analyze the topography of underwater features in detail.
  4. Export and Customization: Users can customize the generated outputs (e.g., adjusting color schemes, adding grid lines) and export the results in formats compatible with GIS software or for direct presentation.
  5. Comparison with Historical Data: If available, users can upload multiple datasets over time to track changes in bathymetry, monitor erosion or sedimentation processes, and understand the evolution of the underwater landscape.

Rating curve development

Description

This online platform is designed to assist hydrologists, environmental scientists, and water resource engineers in developing accurate rating curves for streamflow measurements. The website allows users to upload time-series data collected at specific monitoring sites, and it automatically generates rating curves that relate stage (water level) to discharge (flow) for accurate hydrological analysis and forecasting.

Key Features:

  • Rating Curve Generation: Users can upload field data, including stage (water level) measurements over time and corresponding discharge (flow) data, and the website generates rating curves. These curves show the relationship between the stage (measured as water height) and discharge (volume of water flowing per unit of time), critical for assessing flow at ungauged sites or during varying hydrological conditions.
  • Time-Series Data Upload: The platform allows users to upload data in various formats (Excel, CSV, etc.) containing time-stamped measurements of stage and discharge. This data may include various dates and times, and the website ensures that these are correctly mapped to produce an accurate rating curve over the observed time period.
  • Real-Time Data Integration: For continuous monitoring stations, the website may offer integration with real-time data streams. This allows users to automatically update and refine their rating curves with new data as it becomes available.
  • Interactive Rating Curve Visualization: The platform provides an interactive graphical interface where users can view the relationship between stage and discharge. The rating curve can be zoomed, analyzed, and adjusted based on additional data or refinements, helping users gain insights into hydrological trends and events.
  • Curve Fitting and Model Selection: The website applies various curve-fitting techniques (such as polynomial, logarithmic, or power-law regression) to create the most accurate and reliable rating curves. Users can customize the fitting method, adjust parameters, and check the quality of the fit (e.g., R-squared value).
  • Validation and Quality Control: The platform may include tools for validating the generated rating curve. It compares predicted discharge values with actual field measurements to ensure accuracy. Users can also inspect the curve for any anomalies or discrepancies in the data.
  • Historical Data Analysis: The platform can work with historical data sets, making it possible to generate rating curves for long-term projects or studies based on previously collected data. The time-stamped data can be used to assess seasonal flow variations and historical trends in discharge.
  • Export and Reporting: Once the rating curve is generated, users can export the results in formats such as PDF, Excel, or CSV for inclusion in reports, presentations, or publications. The platform also allows users to export the fitted rating curve equation and associated parameters for further analysis.
  • Custom Time Periods: Users can specify the time period for which they want to generate the rating curve, allowing for more targeted analysis of flow conditions during specific events (such as floods or droughts).
  • User Interface: The platform features an intuitive and easy-to-navigate interface, designed to handle large data sets and perform complex calculations with minimal user input. It includes step-by-step instructions, interactive tools, and visual aids to guide users through the data upload, processing, and rating curve generation steps.

How It Works:

  1. Data Upload: Users upload time-series data containing measurements of stage (water level) and discharge for the monitoring site. The data should include timestamps, which are essential for creating accurate rating curves over the observed period.
  2. Data Processing: The platform processes the uploaded data, ensuring that stage and discharge measurements are correctly aligned by time. The website uses statistical methods to generate a reliable rating curve that models the relationship between the two parameters.
  3. Rating Curve Visualization: After the rating curve is generated, the platform displays it in a graphical format. Users can zoom in on specific sections, compare data points, and view the best-fit curve based on the selected model.
  4. Model Refinement: Users can refine the rating curve by adjusting input parameters, selecting alternative regression models, and analyzing how changes affect the curve's accuracy and reliability.
  5. Export and Share Results: Once satisfied with the rating curve, users can download the results, including the fitted equation, discharge values, and graphical representations, for use in reports, publications, or further hydrological modeling.

Basic Parameters of Hydrology

Description This online platform is designed to assist hydrologists, engineers, and environmental researchers in performing essential hydrological calculations. Users can upload raw field data related to water flow, stream characteristics, and hydraulic properties, and the website automatically calculates a range of hydrological parameters used in river, stream, and watershed studies. Key Features:
  • Discharge Calculation: The website computes streamflow (discharge) based on user-provided measurements, including cross-sectional area and velocity, or through advanced models based on hydrological inputs like flow rating curves.
  • Wetted Perimeter Calculation: Users can input channel geometry data (e.g., width and depth), and the tool will calculate the wetted perimeter, a key factor in assessing flow resistance and hydraulic properties of the stream or river.
  • Depth (MSL): The platform can calculate or visualize the depth of water relative to mean sea level (MSL), which is important for flood modeling, channel design, and other hydrological assessments.
  • Chezy’s Constant (C): The website offers automatic calculation or estimation of the Chezy constant, a coefficient used to describe the roughness of the flow surface, relevant for determining flow velocity and resistance.
  • Manning’s Roughness Coefficient (n): A feature that allows users to determine Manning's n, a crucial parameter in estimating flow resistance for open channel flow. The website may provide a database or guidelines for estimating Manning's n based on channel type and flow conditions.
How It Works:
  1. Upload Data: Users can upload datasets containing measurements like channel geometry (width, depth, slope), velocity, and flow data (e.g., flow rating curves, water stage data).
  2. Data Processing: The platform processes the uploaded data, applying relevant equations and empirical formulas to compute the hydrological parameters.
  3. Visualization & Reports: Once the calculations are complete, users receive a detailed report with graphs, charts, and tables summarizing the results. Parameters like discharge, wetted perimeter, and flow resistance values are displayed in easy-to-read formats for further analysis or reporting.
  4. Parameter Customization: Users can modify the input data or adjust parameters like roughness coefficients to see how changes affect the calculations, aiding in sensitivity analysis or model calibration.
  5. Export Options: The website allows users to export the results to common formats like Excel, PDF, or CSV for further analysis or documentation.

River Sediment deposition Survey

A river sedimentation survey is an essential process for understanding the movement and deposition of sediments within river systems. It involves measuring the amount, type, and distribution of sediments in the riverbed and water column. These surveys provide valuable data that helps in river management, infrastructure design, flood control, environmental protection, and ecosystem management. Importance of River Sedimentation Survey
  1. Flood Management and River Hydraulics
    • Flood Risk Assessment: Sedimentation can significantly alter a river's flow dynamics by changing the channel depth, width, and slope. Regular sedimentation surveys help monitor these changes, providing data to predict how sediment accumulation may increase flood risks in certain areas. This information is crucial for designing and implementing effective flood control systems.
    • Maintaining River Capacity: Over time, sediment buildup can reduce a river's capacity to carry water, leading to increased flooding and reduced water flow efficiency. Surveys help to track sedimentation rates and support the management of sediment removal or river dredging to maintain the river's capacity.
  2. Infrastructure Design and Maintenance
    • Dam and Reservoir Management: Sedimentation surveys are crucial for assessing the buildup of sediment in reservoirs behind dams. High sedimentation can reduce the storage capacity of reservoirs, affecting water supply and energy generation. Regular sedimentation data helps engineers plan for sediment removal and maintenance, ensuring the long-term functionality of dams.
    • River Channel Maintenance: Sediment accumulation in the river channel can lead to blockages and reduced flow efficiency, impacting infrastructure like bridges, culverts, and weirs. Sedimentation surveys provide the data needed for maintenance and clearing of these structures.
  3. Sediment Transport Studies
    • Understanding Sediment Movement: Sedimentation surveys track the movement of sediments—such as sand, silt, clay, and organic matter—within the river system. This is essential for understanding how sediments move during different flow conditions, which affects river morphology and sediment deposition patterns.
    • Assessing Erosion and Deposition: Monitoring sedimentation helps identify areas of riverbank erosion and sediment deposition, which can affect the stability of riverbanks, infrastructure, and ecosystems. It also helps predict how sediment distribution will change with varying river conditions.
  4. Water Quality and Environmental Protection
    • Sediment’s Impact on Water Quality: Excessive sedimentation can degrade water quality by introducing contaminants and reducing light penetration, which affects aquatic life. A sedimentation survey helps in identifying areas where sedimentation may be contributing to water quality issues, enabling targeted remediation strategies.
    • Ecosystem Health: The amount and type of sediment in a river can affect aquatic habitats, including the availability of food and nesting sites for fish and other species. By understanding sediment transport and deposition patterns, the health of aquatic ecosystems can be better managed and preserved.
  5. Hydropower and Energy Projects
    • Turbine Efficiency: In hydropower projects, sedimentation can have a significant impact on turbine efficiency by causing abrasion and clogging. Sedimentation surveys help identify areas of high sediment load, allowing for better management of the water intake systems and turbines.
    • Long-term Project Viability: Monitoring sedimentation in rivers used for hydropower generation helps ensure the longevity of the infrastructure and minimizes the risks posed by sediment accumulation, which can reduce energy output and damage equipment.
  6. River Restoration and Conservation
    • Restoration Planning: Sedimentation surveys are important for river restoration efforts, as they provide insights into areas that require attention for ecological rehabilitation. Whether it’s mitigating excessive sedimentation or restoring natural sediment processes, this data informs conservation and rehabilitation strategies.
    • Sustainable Sediment Management: Understanding sediment dynamics is crucial for balancing the need for sediment management with the preservation of natural ecosystems. A sedimentation survey helps identify sustainable approaches to managing river sedimentation.
  7. Climate Change and Sediment Dynamics
    • Impacts of Climate Change: Sedimentation surveys help track how changing climate conditions (such as altered rainfall patterns or increased storm frequency) impact sediment transport and deposition. This data is vital for adapting river management strategies to future climate scenarios.
    • Sea-Level Rise: In rivers near coastlines, rising sea levels can influence sediment dynamics, leading to increased sediment deposition in certain areas. Regular sedimentation surveys help in understanding and managing these evolving conditions.
Description for Website A river sedimentation survey involves the systematic collection and analysis of data on the sediment within a river system. This includes measurements of sediment types, concentrations, and the distribution of sediment deposits along the riverbed. The survey is conducted using a combination of field methods and specialized equipment, including sediment samplers, sediment corers, and sonar-based tools that allow for both surface and sub-surface sediment measurements. Key Survey Methods:
  • Sediment Sampling: Collecting samples from various points along the river to analyze sediment composition, size, and concentration.
  • Hydraulic Profiling: Using tools like Acoustic Doppler devices or echo sounders to map riverbed topography and identify sediment buildup areas.
Applications:
  • Flood and Erosion Control: Helps in understanding how sedimentation influences flood risks, river capacity, and erosion patterns, supporting effective management.
  • Environmental Monitoring: Tracks the impact of sedimentation on water quality, aquatic habitats, and ecosystem health.
  • Infrastructure Planning: Assists in the design and maintenance of river-based infrastructure such as dams, reservoirs, and flood control systems.
  • Hydropower Projects: Provides critical data for managing sediment accumulation and maintaining the efficiency of hydropower plants.
Benefits:
  • Provides detailed insights into sedimentation dynamics in river systems.
  • Essential for flood risk prediction and management.
  • Helps in maintaining and managing river-based infrastructure.
  • Supports environmental conservation and water quality management.
  • Aids in optimizing the design and operation of hydropower projects.
In summary, a river sedimentation survey is a vital tool for understanding sediment dynamics and its impacts on river systems. By providing detailed, accurate data, these surveys help guide decisions related to flood management, infrastructure development, environmental protection, and long-term river sustainability.

Bathemetry Survey

A 
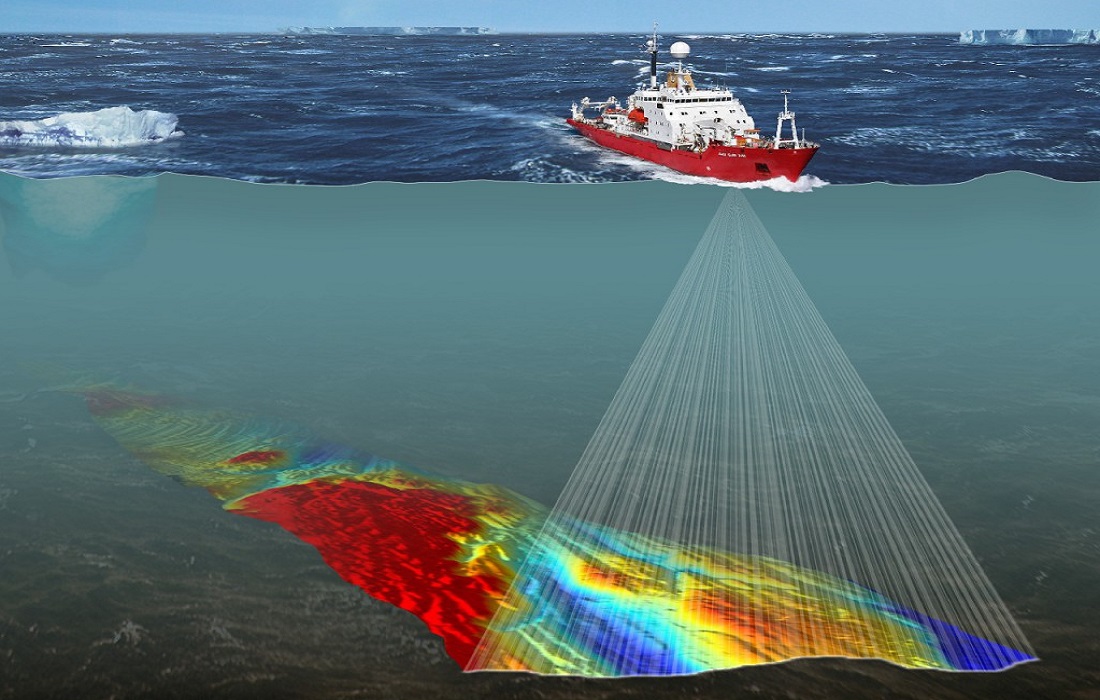
bathymetry survey is the process of measuring the depth and topography of a water body, such as a river, lake, or ocean. It is the underwater equivalent of a topographic survey on land and provides detailed information about the submerged features of a water body, such as the shape of the seafloor, riverbed, or lakebed. These surveys are conducted using specialized equipment, such as echo sounders, multibeam sonar systems, or LiDAR, to map underwater terrain. Importance of Bathymetry Survey
  1. Water Resource Management
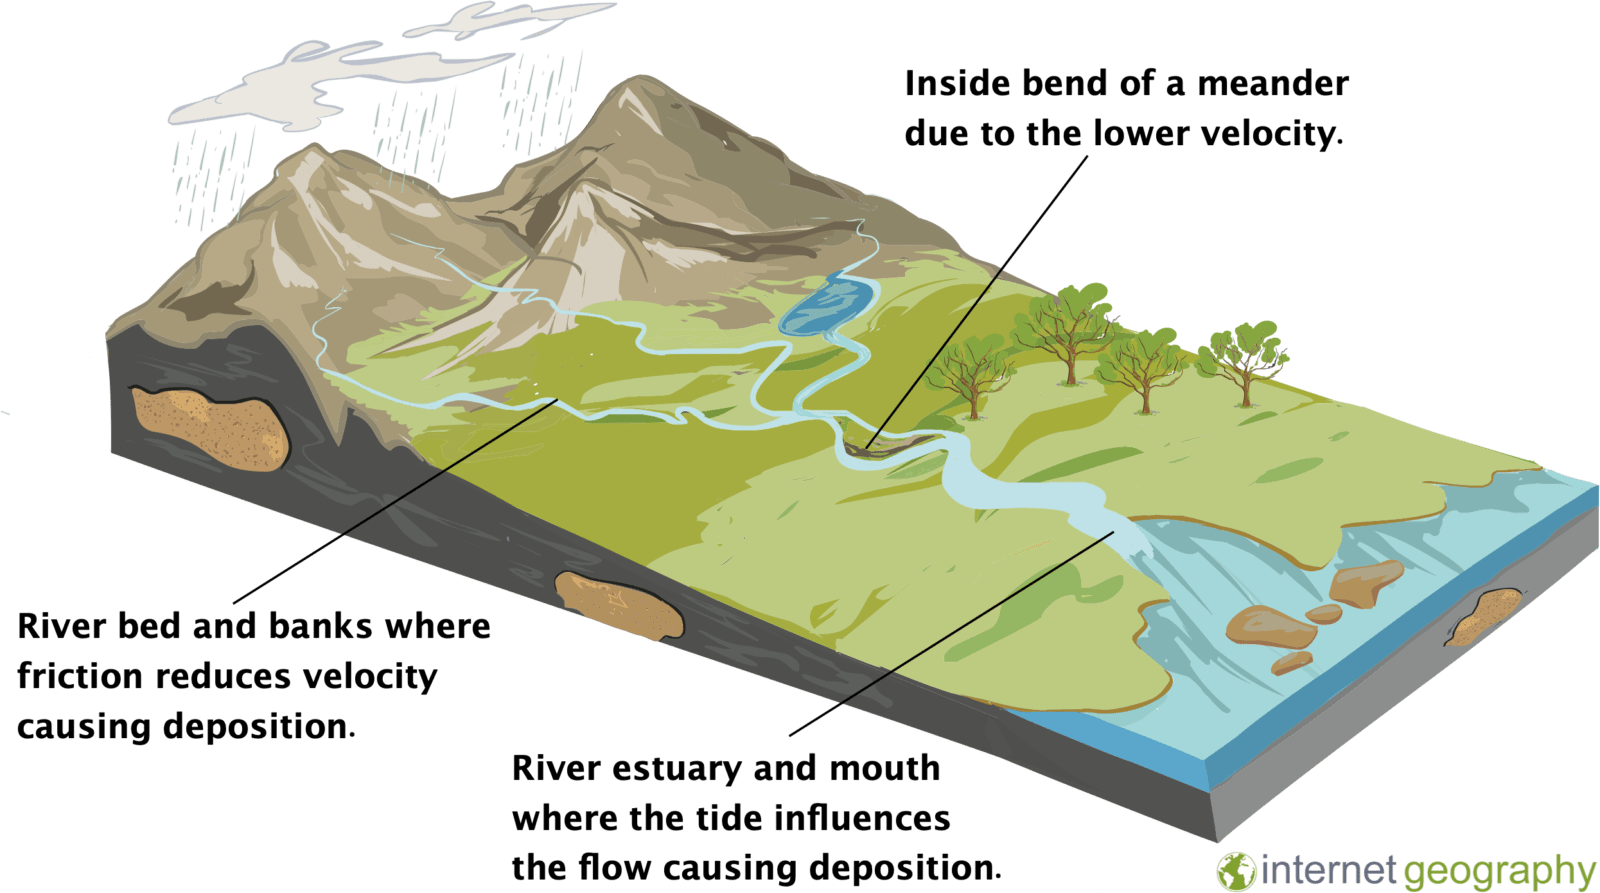
    • Flood Prediction and Management: Bathymetry surveys provide detailed data on underwater features that affect the flow of water, such as submerged hills, channels, and valleys. This data is crucial for predicting flood risks, especially in rivers and reservoirs, and helps in designing flood control measures like dams, levees, and floodplain management strategies.
    • Hydraulic Modeling: Bathymetric data is key in developing accurate hydraulic models, which simulate water flow and help in the design and management of water storage and distribution systems.
  2. Navigation Safety
    • Safe Passage for Vessels: Bathymetric surveys are essential for creating navigational charts and ensuring that ships, boats, and other watercraft can safely navigate through water bodies without running aground. Understanding the depth and underwater hazards like rocks, reefs, and sandbars is critical for marine safety.
    • Port and Harbor Design: Bathymetric data is used to design and maintain ports, harbors, and shipping channels, ensuring they are deep enough to accommodate vessels of varying sizes and preventing blockages or accidents due to shallow areas.
  3. Environmental Monitoring and Conservation
    • Ecosystem Health: Bathymetric surveys help identify the underwater features that support aquatic ecosystems, such as coral reefs, submerged vegetation, and fish habitats. Monitoring changes in bathymetry over time can indicate shifts in ecosystems due to natural factors or human impacts, such as sedimentation, erosion, or pollution.
    • Coastal Protection: In coastal areas, bathymetric data helps to assess the effects of tides, waves, and storm surges on the shoreline and underwater features. This is vital for coastal protection efforts, including the design of breakwaters and other shoreline stabilization structures.
  4. Sediment Transport and Erosion Studies
    • Sediment Movement: Bathymetric surveys provide insights into sediment transport dynamics by revealing areas of erosion and deposition on the riverbed or ocean floor. This information is critical for managing erosion, protecting infrastructure, and designing measures to mitigate sedimentation in reservoirs or coastal areas.
    • Understanding River and Coastal Morphology: For rivers and coastal environments, bathymetric surveys help track the movement of sediment, which is crucial for managing sedimentation in reservoirs, river channels, and harbors.
  5. Hydroelectric and Energy Projects
    • Dam and Reservoir Design: Bathymetric data is essential for the design and maintenance of dams and reservoirs. By understanding the depth and shape of the reservoir bed, engineers can optimize storage capacity and improve flood control capabilities.
    • Turbine Placement and Hydropower Planning: For hydroelectric projects, bathymetric surveys help in assessing the feasibility of dam sites and identifying optimal locations for turbine placement by providing a detailed understanding of the water flow and reservoir capacity.
  6. Archaeological and Historical Research
    • Underwater Exploration: Bathymetric surveys are used in underwater archaeology to locate and map submerged structures, shipwrecks, and other historical artifacts. Understanding the underwater topography helps researchers pinpoint potential sites for exploration and excavation.
    • Preservation of Submerged Heritage: Bathymetry surveys also aid in monitoring the preservation of submerged cultural heritage, ensuring that historical sites and structures are protected from environmental damage or human activity.
  7. Climate Change and Oceanography Studies
    • Sea-Level Rise and Coastal Flooding: Bathymetric data plays an important role in studying the effects of sea-level rise due to climate change. It provides the baseline for monitoring changes in coastal areas, which is crucial for flood risk assessments and adaptation planning in vulnerable regions.
    • Ocean Circulation and Climate Modeling: In oceanography, bathymetric data helps scientists understand ocean currents, wave dynamics, and other factors that influence climate patterns. Changes in the ocean floor can affect circulation patterns, which in turn impact weather systems.
Description for Website A bathymetric survey is a critical process for mapping the underwater landscape of rivers, lakes, oceans, and other bodies of water. Using state-of-the-art technology such as sonar, LiDAR, or echo sounders, bathymetric surveys measure the depth, shape, and features of the submerged terrain. These surveys play a vital role in a wide range of industries, including navigation, environmental management, flood control, and hydroelectric projects. The data collected through bathymetric surveys helps engineers, scientists, and conservationists understand water bodies' morphology, sediment dynamics, and flow characteristics. It is essential for ensuring the safe navigation of vessels, designing effective flood protection systems, managing sedimentation, monitoring ecosystems, and supporting archaeological research. Key Benefits:
  • Accurate mapping of underwater features and topography.
  • Enhanced safety for navigation and vessel traffic.
  • Improved management of water resources, flood risks, and coastal areas.
  • Support for environmental conservation and ecosystem monitoring.
  • Essential for infrastructure design and maintenance (dams, ports, etc.).
Vital for climate change studies, including the impact of sea-level rise.

River Crossection

River cross-sections are fundamental tools for understanding the physical and hydraulic properties of a river. They are used in a wide range of applications, from flood management and discharge measurement to sediment transport and ecosystem conservation. By providing essential insights into how water flows and interacts with the river channel, these cross-sections help improve river management, infrastructure design, and environmental protection efforts. An Acoustic Doppler Current Profiler (ADCP) is a modern and advanced tool used in hydrology and river engineering to measure water flow velocity and discharge. When used to collect data across a river, it can produce detailed river cross-sections, which are critical for understanding the river's flow dynamics, its depth, and velocity distribution. Key Concepts:
  1. River Cross-Section: This is a vertical profile of a river channel, showing its shape, depth, and width at a specific location. It is an essential tool for evaluating river hydraulics and is used in flood modeling, sediment transport studies, and water resource management.
  2. ADCP (Acoustic Doppler Current Profiler): An ADCP is an instrument that uses sound waves to measure the velocity of water at various depths across the river's cross-section. By emitting sound pulses and analyzing the frequency shift (Doppler effect) as they bounce off particles in the water, the ADCP can determine water speed and flow direction.
How ADCP Measures River Cross-Sections: The ADCP provides high-resolution data on the velocity of water at different depths and across the width of the river. The process works as follows:
  1. Deployment: The ADCP is typically mounted on a boat or a stationary platform at the river's surface or on the riverbed. It can also be deployed from the shore or on a bridge.
  2. Data Collection: The device emits sound pulses that bounce off particles suspended in the water (like sediment or bubbles). By measuring the frequency shift of the reflected sound waves, the ADCP calculates the velocity of water at various depths across the river's width.
  3. Cross-Section Creation: The ADCP collects data continuously across the river, capturing the speed of the water at different locations. This information is used to create a detailed cross-sectional profile, which includes:
    • Water Depth: Measured at various points along the river.
    • Velocity Distribution: The flow speed at different depths and across the width of the river.
    • Flow Direction: The direction of water flow, which can vary across the river’s width.
  4. Post-Processing: The data collected is then processed and integrated into software that creates a visual representation of the river cross-section, showing depth, velocity, and flow characteristics.
Applications of River Cross-Sections Measured by ADCP:
  1. Hydraulic Modeling: ADCP-derived cross-sections help in creating hydraulic models to simulate and predict flow conditions under different scenarios, such as flood events or changes in river infrastructure.
  2. Discharge Measurement: By combining velocity data with depth measurements, the ADCP allows for the calculation of river discharge, which is the volume of water flowing per unit of time. This is especially useful in river management and flood forecasting.
  3. Sediment Transport Studies: The velocity profiles collected by the ADCP help scientists understand how sediment moves through the river, which is crucial for managing erosion, sediment deposition, and water quality.
  4. Floodplain Analysis: Detailed cross-sections are used to evaluate how changes in riverbed morphology, channel shape, or water levels affect the floodplain, helping in flood risk assessment and mitigation planning.
  5. Infrastructure Design and Management: Engineers use river cross-sections to design and maintain infrastructure such as bridges, dams, and levees. Understanding the river's cross-sectional profile helps ensure that structures are built to withstand high flow conditions.
Advantages of Using ADCP for River Cross-Section Measurements:
  • High Precision: ADCPs provide accurate, real-time data on river velocities and depths, which is more precise than traditional methods (e.g., flow gauging stations or manual measurements).
  • Non-Invasive: ADCPs operate without disturbing the river’s flow or sediment, allowing for safer and more reliable measurements, especially in sensitive ecosystems.
  • Efficiency: The technology allows for rapid data collection over large river sections, reducing the time and effort needed compared to traditional methods.
  • Versatility: ADCPs can be used in various river environments, from slow-moving streams to fast-flowing, turbulent rivers, providing valuable data in many different conditions.
Summary: Incorporating ADCP technology into river cross-section surveys offers a powerful, efficient way to measure river dynamics, discharge, and flow velocities. The data collected not only provides a clear snapshot of a river's physical properties but also supports effective flood management, water resource planning, and environmental protection.

Rating Curve

A River Rating Curve (also known as a Stage-Discharge Curve) is a fundamental tool used in hydrology and water resource management. It represents the relationship between the stage (water level) and the discharge (flow rate) in a river or stream. This curve is essential for understanding how much water flows through a river at a given height and is used to estimate flow rates at locations where direct measurements might not be possible. Key Components:
  1. Stage (Water Level): This refers to the height of the water surface above a reference point (often referred to as the riverbed). It is typically measured in meters or feet. The stage is influenced by factors such as rainfall, snowmelt, or upstream flow.
  2. Discharge (Flow Rate): The amount of water passing through a cross-section of the river per unit of time, typically measured in cubic meters per second (m³/s) or cubic feet per second (cfs). Discharge is influenced by the stage, but also by the river's width, depth, and velocity.
Purpose and Use:
  • Hydrological Modeling: Rating curves are used to predict river discharge based on stage readings. This is crucial for managing water resources, flood forecasting, and designing infrastructure like dams and bridges.
  • Flood Monitoring: By understanding the discharge at different stages, authorities can predict potential flooding risks and issue warnings.
  • Water Quality & Ecology: Discharge rates influence water quality, habitat conditions, and the movement of sediment, which are important for ecosystem management.
How It Works:
  • The curve is developed by collecting data over time, where both stage and discharge are measured at a particular location on the river. As water levels rise, the discharge also increases, but the relationship is often nonlinear, meaning that small increases in stage can result in large increases in discharge.
  • Once the curve is developed through field measurements, it serves as a predictive tool, allowing river managers and engineers to estimate the discharge for a given water level.
Factors Affecting the Rating Curve:
  • River Shape and Size: The channel geometry, such as width, depth, and slope, affects the curve's steepness. Wider or deeper channels can carry more water at lower stages.
  • Sediment and Obstructions: Sediment build-up, vegetation, or artificial structures like dams can alter the flow, shifting the rating curve over time.
  • Weather Events: Extreme rainfall or drought can change the relationship between stage and discharge, requiring updates to the curve.
Benefits:
  • Accuracy in Flow Predictions: Rating curves provide a reliable method for estimating discharge even when direct flow measurements are not available.
  • Flood Management: Helps in anticipating potential flood events based on river stage and in planning for flood control measures.
  • Water Resource Planning: Assists in managing the allocation of water for irrigation, drinking, or industrial use.
testimonial
As a civil engineer/Manager at AKP Instruments and Consultants, we specialize in precise hydrological analysis and water resource management. Our services, including river cross-section surveys, ADCP surveys, and rating curve development, provide critical data for effective flood management and infrastructure planning. We ensure accurate, reliable measurements for sustainable water systems.
Ankit Prashar (7+ Years of Experience in Hydrological Projects)
Manager/Engineer (Projects/Sales)

Do you have questions?

Our comprehensive Hydrological Services are designed to provide essential data and insights for effective water resource management, flood monitoring, and environmental assessment...

We are committed to providing you with the highest quality products and a seamless shopping experience.

Yes! We believe in ensuring that you fully understand and can effectively use the products you purchase from us.

ADCP stands for Acoustic Doppler Current Profiler, a highly sophisticated instrument used to measure water currents (velocity) at different depths in rivers, lakes, oceans, and other bodies of water.

If you have any technical questions or need assistance, we are here to help. Simply reach out to us via our Contact Us section.

My question is not here.

Have a question?
We are glad to consult you!

Partner Manufacturers